Spark Sql Optimisation - A data skew story
Performance Optimisation is hard, I had a few lessons the hard way with Elasticsearch Query Optimisation and OpenTSDB/HBase Tuning in the past.
Spark Optimisation or Spark SQL Optimisation results in gazillions results, each one talking about how to tweak configurations and settings, How people solved a performance problem in their respective environment, be it on-premise or on cloud. This post is a mixture of adjusting spark settings and other interesting things.
One of the problems I was handed over started with a backstory: We wanted to run two queries against data we had in 4 different tables. The final query did some aggregations BUT the final query never finishes in Athena - it times out all the time even for a day's worth of data.
At this point, I was told this is, in fact, a performance problem due to two things:
- data volume and
- data skew
Background
Tasks
- We need to carry analysis on data in 4 tables by joining them and consolidating results in groups.
- Run queries every day so that we have data points for our analysis and
- Run backlog for at least last 3 months.
Setup
Everything runs in AWS, data is stored on S3, external tables on top of data in S3, Hive and Athena used for querying data.
Tables
4 Tables with Varying data volumes, let's call these tables as: table1, table2, table3, and table4.
- table1:
30 to 50 million records a day,8 to 10 GB parquetsnappy compressed a day, 65 columns - table2:
50 to 80 million records a day,3 to 4 GB orca day, 6 columns - table3:
450 to 550 million records a day,10 to 12 GB orca day, 5 columns - table4:
80 to 100 million records a day,7 to 8 GB orca day, 18 columns
Different file formats are due to legacy processing requirements among different users.
Queries
Queries were fired in this order in both Athena and Spark Sql. I have separated few queries into views for clarity. Originally there were two big queries. Also, i have fudged the column names.
### dates in the queries below are kept for readability, we can use a $variable in scala/spark.
1.
SELECT p_id, col11, col12, col13, col14, col15, received_date FROM table1 p WHERE received_date = date('2018-11-01')
-- output called **view1**
2.
SELECT a_id, p_id, col21, col22, col23, event_date FROM table2 a where event_date = date('2018-11-01')
-- output called **view2**
3.
select
v1.received_date, v2.event_date, v2.p_id, v2.a_id, v1.col11,
case when v1.col12 = 'Tesla' then 'Battery'
     when v1.col12 = 'Prius' then 'Hybrid'
     when v1.col12 in ('Ford', 'Nissan') then 'Petrol'
     when v1.col12 = 'Lamborghini' then 'Money'
     else 'Petrol'
end as market,
case when v1.col13 = 'PERSONAL_COMPUTER' then 'Desktop'
      when v1.col13 = 'SMARTPHONE' then 'Mobile'
      when v1.col13 = 'TABLET' then 'Tablet'
      when v1.col13 like '%APP%' then 'App'
      else 'Other'
end as device,
case when v1.col14 = 'Web' then 'Web'
     when v1.col14 like '%APP%' then 'App'
end as platform,
replace(col23, 'some-text-here') as sl
from view1 v1
    inner join view2 v2
 on v1.p_id = v2.p_id
 and v1.received_date = v2.event_date
where v1.col15 not like '%.txt'
-- output called **view3**
4.
select * FROM table3 where event_date = date '2018-11-01'
-- output called **view4**
5.
select * FROM table4 where event_date = date '2018-11-01'
-- output called **view5**
--- final query
6.
select  v3.col11
, v3.market
, v3.device
, v3.platform
, v3.sl
, v5.size
, v4.name
, approx_count_distinct(v3.a_id) as sum_a
, approx_count_distinct(v4.b_id) as sum_b
, approx_count_distinct(v5.b_id) as sum_b_r
, sum(case when v5.wa = true then 1 else 0 end) as wb
, sum(v5.tt) as sum_tt
, sum(v5.c/1000) as all_b_1000
, sum(case when v5.wa = true then (c/1000) end) as win_b_1000
, received_date
from view4 v4
   inner join view3 v3
     on v3.a_id = v4.a_id
   left join view5 v5
     on v4.a_id = v5.a_id
     and v4.b_id = v5.b_id
     and v4.event_date = v5.event_date
where v4.event_date = date '2018-11-01'
group by 1, 2, 3, 4, 5, 6, 7, 15
AWS EMR
We started with a basic EMR setup and changed it over time. All jobs in EMR run on Spot instances. We always used settings similar to these (tweaking mostly these switched):
### for CPU settings we chose to leave 1/3 of the cores for OS related tasks, similarly we calculated away 1/3 of executor memory for different overheads.
#Initial Run, AWS machines
EMR:
     master instance: 1 * M42xlarge - 8 vCPU, 32 GB
     core instances: 20 * R42xlarge - 8 vCPU, 61 GB
     use maximise resources as true on EMR
Spark:
    "spark.sql.sources.outputCommitterClass" -> "com.netflix.bdp.s3.S3PartitionedOutputCommitter",
    "spark.hadoop.s3.multipart.committer.conflict-mode" -> "replace",
    "spark.shuffle.compress" -> "true",
    "spark.shuffle.spill.compress" -> "true",
    "spark.shuffle.consolidateFiles" -> "true",
    "spark.reducer.maxSizeInFlight" -> "96",
    "spark.shuffle.file.buffer" -> "1024k"
    "spark.sql.shuffle.partitions" -> "250"
We changed machine types and some spark settings for different set of test:
Spark:
    "spark.executor.cores" -> "XX",
    "spark.executor.memory" -> "YYg",
    "spark.sql.shuffle.partitions" -> "ZZ"
By using maximizeResourceUtilisation on EMR, we just specify CPU and memory requirements for one executor and let EMR create maximum possible executors for us on the fly.
Journey to a Solution
Errors
On a small subset of data the queries would work fine in Athena and Spark as well.
The queries would not run for a day in Athena or in Spark. Athena would throw a timeout error and Spark would run for hours and throw what seemed like a new error each time.
Test 1: More Power
As usual the first try is to throw more computing power at the problem to see what happens. So here is what we did:
#Initial Run
EMR:
     master instance: 1 * M42xlarge - 8 vCPU, 32 GB
     core instances: 20 * R42xlarge - 8 vCPU, 61 GB
Spark:
    "spark.executor.cores" -> "3",
    "spark.executor.memory" -> "21g",
    "spark.sql.shuffle.partitions" -> "250"
#New Setup
EMR:
     master instance: 1 * M42xlarge - 8 vCPU, 32 GB
     core instances: 50 * R42xlarge - 8 vCPU, 61 GB
Spark:
    "spark.executor.cores" -> "3",
    "spark.executor.memory" -> "21g",
    "spark.sql.shuffle.partitions" -> "250"
This did not help, and the spark job kept on running for 5 odd hours before giving up. We observed that a few tasks are taking much longer than others.
Some of the errors we saw in logs:
org.apache.spark.shuffle.FetchFailedException: Failure while fetching StreamChunkId{streamId=1780552669838, chunkIndex=0}: java.lang.RuntimeException: Executor is not registered (appId=application_1546982523199_0001, execId=511)

######## OR
INFO BlacklistTracker: Blacklisting node ip-xx-xx-xx-xx.compute.internal with timeout 1547056015319 ms because node is being decommissioned by Cluster Manager with timeout 20 seconds.

######## OR
INFO TaskSetManager: Task 131.1 in stage 6.1 (TID 48894) failed, but the task will not be re-executed (either because the task failed with a shuffle data fetch failure, so the previous stage needs to be re-run, or because a different copy of the task has already succeeded).
The reasons for these failures were different:
- we were using spot instances for EMR nodes and a few times spot instances would go down or were removed from marketplace etc. As these jobs were running for hours, chances of spot instances taken away were not too thin.
- Initial tries to run this job were done on few machines with inadequate RAM, so some tasks may have OOMed.
Test 2-N: Even More Power (and tweaks)
The fact that we could see most tasks finishing and a few tasks taking way too long confirmed the previous suspicion that the data is skewed. We did not know how big was the skew But it could not have been so big that it takes hours on 75-100 odd machines. We wanted to see if it runs with more resources (without first going into skew related solutions), we kept on testing things with more resources and spark settings.
#Last Run
EMR:
     master instance: 1 * M42xlarge - 8 vCPU, 32 GB
     core instances: 50 * R42xlarge - 8 vCPU, 61 GB
Spark:
    "spark.executor.cores" -> "3",
    "spark.executor.memory" -> "21g",
    "spark.sql.shuffle.partitions" -> "250"

#New Setup
EMR:
     master instance: 1 * M42xlarge - 8 vCPU, 32 GB
     core instances: 50 ( | 75 | 100 ) * R44xlarge - 16 vCPU, 122 GB
Spark:
    "spark.executor.cores" -> "5", ("5" | "5" | ...)
    "spark.executor.memory" -> "51g",("30" | "20" | ...)
    "spark.sql.shuffle.partitions" -> "250" (| "750" | "1000" | "5000" | "10000")
We hit max spot instance count (for our account) while running 3-4 different EMR clusters with 50/75 machines each. And it was costing real $$$s.
While we ran several such tests for hours and hours, the job run time (or die time as it was) kept on varying between 3 hours to 5-6 hours. We did look at Executors tab inside EMR's spark console.
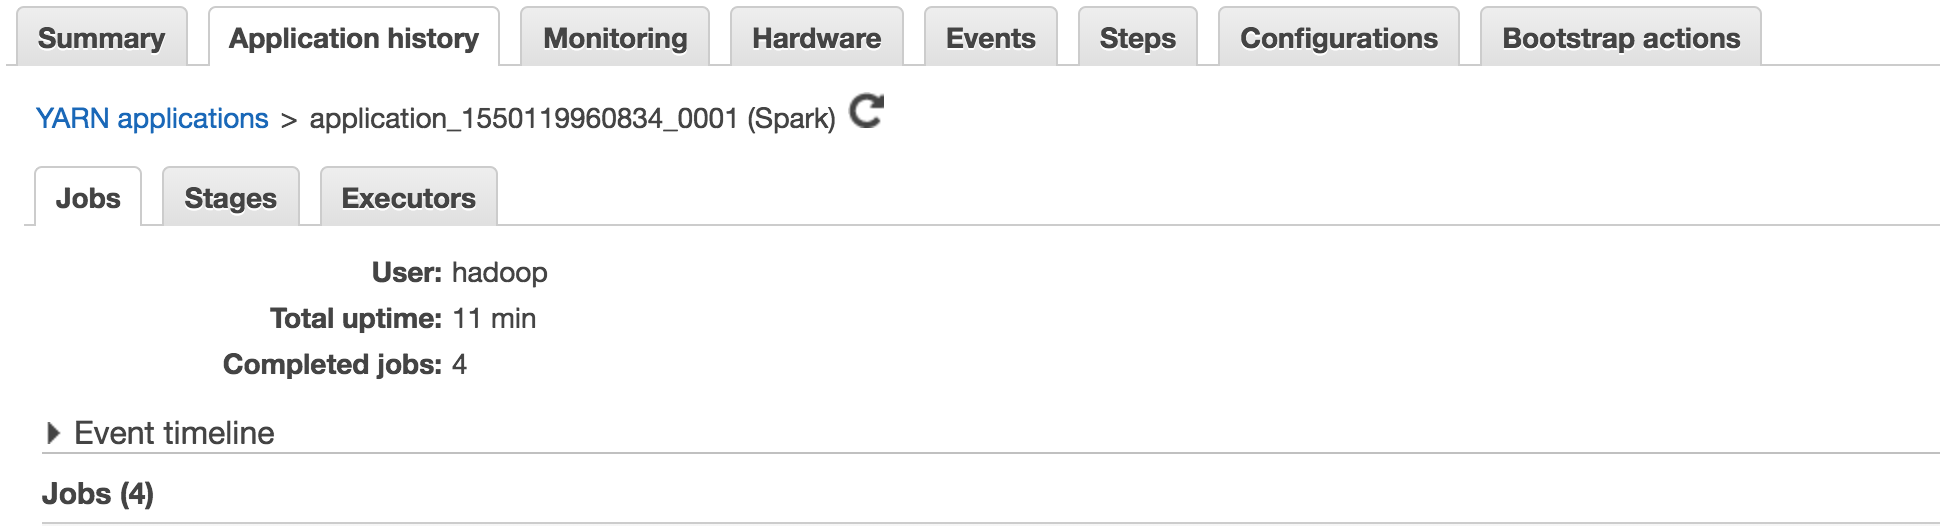
We checked shuffle read/write time, GC time, memory usage. Shuffle read/write for a few tasks were 15-20X more than others and these tasks were doing 20-30% of the total time as GC.
These numbers continued to confirm "data skew" and nothing else.
For security and logistical reasons, we did not have access to the Spark UI and Ganglia, till this point.
Step Back : Fix Access
While EMR's console shows spark steps and executors it does not give all the features of Spark UI. We sorted our access to two very important tools: Spark UI and Ganglia.
Once we had access to Spark UI, we could see stages with DAG and numbers belonging to each stage. It also had a SQL tab which showed us few important things visually.

This tab shows a graph of how data flows between different steps with:
- what is being broadcasted and shuffled
- how much time and memory is being spent on each stage
- how much data is being read, transferred as bytes and records
One such inspection of this tab shocked us (even when this data was kind of available in EMR's Stages tab, we managed to overlook it.), one stage was dealing with TBs of data and 100 billion records to process!!
On the SQL tab, We could see that tables with 38, 34, 58 and 289 million records were being read. It seemed to be stuck on the SortMergeJoin phase with number of output rows as 100,000,000,000 (rounded). That is 100 billion records which are way more than the total combined data from all 4 tables.
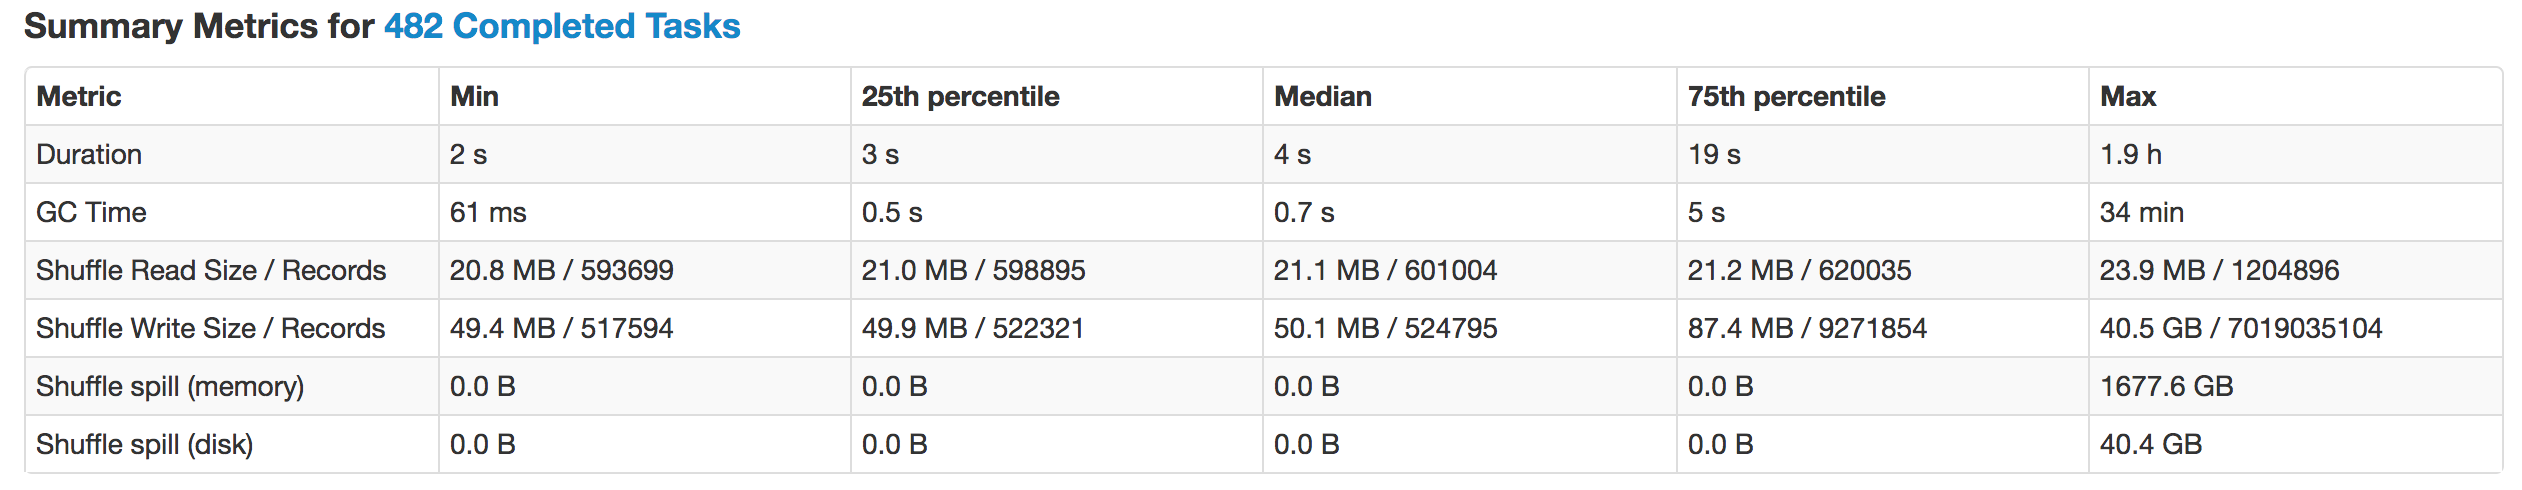
We discovered the same information across different tabs in Spark and EMR UI:
Data Skew: few tasks taking way longer. Note the difference between 75th Percentile and Max.
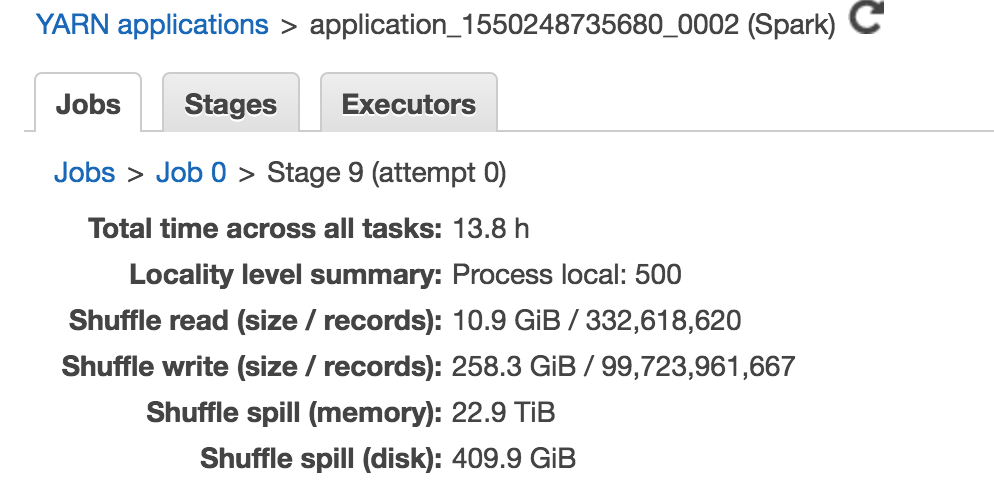
2. We had TBs of shuffle spill. One screenshot showing 18TBs of shuffle.
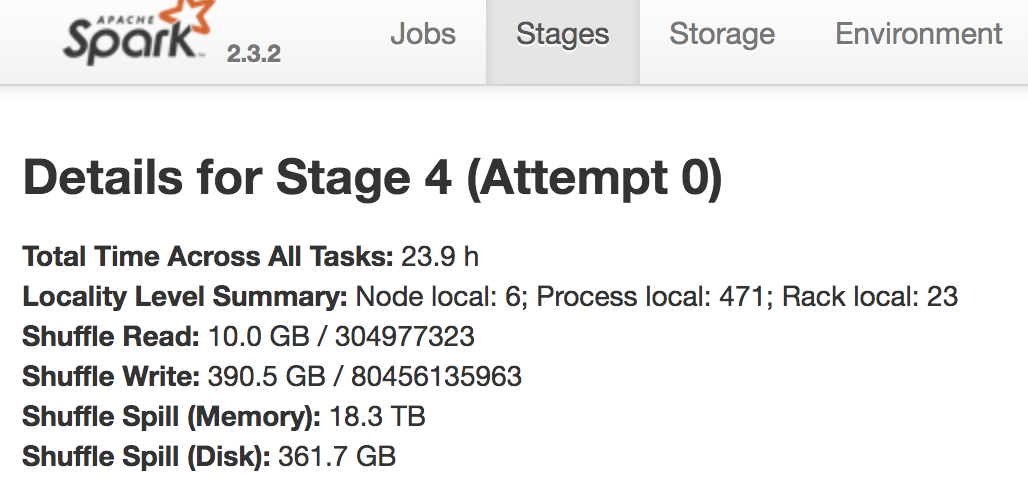
3. We had 100 billion records! Note the shuffle write records.
This discovery led to an important question:
# What type of join increases the total number of output records?
The answer is none! No join type increases the number of output records, a left join would have at max the number of records on the left of the join. In this case, max was 289 million.
Unless there are duplicate records in data, demonstrated via sqlfiddle here.
Houston, We have a problem
Upon investigation, we found that all 4 of our tables had duplicate records, in the range of 1%-2%. This lead to an explosion of output records which meant the entire process was slow as more data was shuffled across, more processing was done, it needed more memory.
Ideally, we should not have these duplicates but that is a different problem involving people and processes.
It is important to note that looking at and comprehending the spark physical and logical plans could not have helped. Those plans cannot tell us if there are duplicates in the data and they cannot tell us how big or small a shuffle would be.
We actually looked at the plans and tried (kind of knowing it won't work as the plan did not raise specific alarms other than too many shuffles) various things: distribute by, repartition, broadcast, salting keys etc with no success.
One broadcast test led us to beef up the master node to a monstrous box and even then we kept on getting
spark.driver.maxResultSize is smaller than results sent to it. defaults to 1024mb
We increased this limit to max a driver can take i.e 8 GB (or something), and the job would still fail. As the data to broadcast was too big.
One Salting test led us to introduce a combined column containing values from all other group by columns. Again all such tests failed to improve the behavior of the job.
Duplicates eh?, Easy Peasy
Since we knew the problem now, Here is how we removed them in SQL (for queries 1,2,4 and 5 above):
### notice a new subquery with count(*)>1
1.
SELECT p_id, col11, col12, col13, col14, col15, received_date FROM table1 p WHERE received_date = date('2018-11-01') and p_id not in (SELECT p_id FROM table1 where received_date = date('2018-11-01') group by p_id having count(*) > 1)
-- output called **view1**
2.
SELECT a_id, p_id, col21, col22, col23, event_date FROM table2 a where event_date = date('2018-11-01') and a.a_id not in (select a_id FROM table2 where event_date = date('2018-11-01') group by a_id having count(*) > 1)
-- output called **view2**

## Similar approach for queries 4 and 5 with the exception that uniqueness is defined as a_id + p_id
## queries 3 and 6 remain unchanged.
Curious minds would note that these subqueries remove all duplicate records and do not leave one record for processing, but this is not of concern when the job is not running at all :-)
It's time to run a spark job, we used below EMR and Spark Settings:
EMR:
     master instance: 1 * M42xlarge - 8 vCPU, 32 GB
     core instances: 75 * R44xlarge - 16 vCPU, 122 GB
Spark:
    "spark.executor.cores" -> "5",
    "spark.executor.memory" -> "40g",
    "spark.sql.shuffle.partitions" -> "1000"
With duplicates removed, the spark job now started to run and complete! Hurray! We do not have TBs of spill and do not have 100 billions record to worry about. A SQL status in Spark UI looked like this:
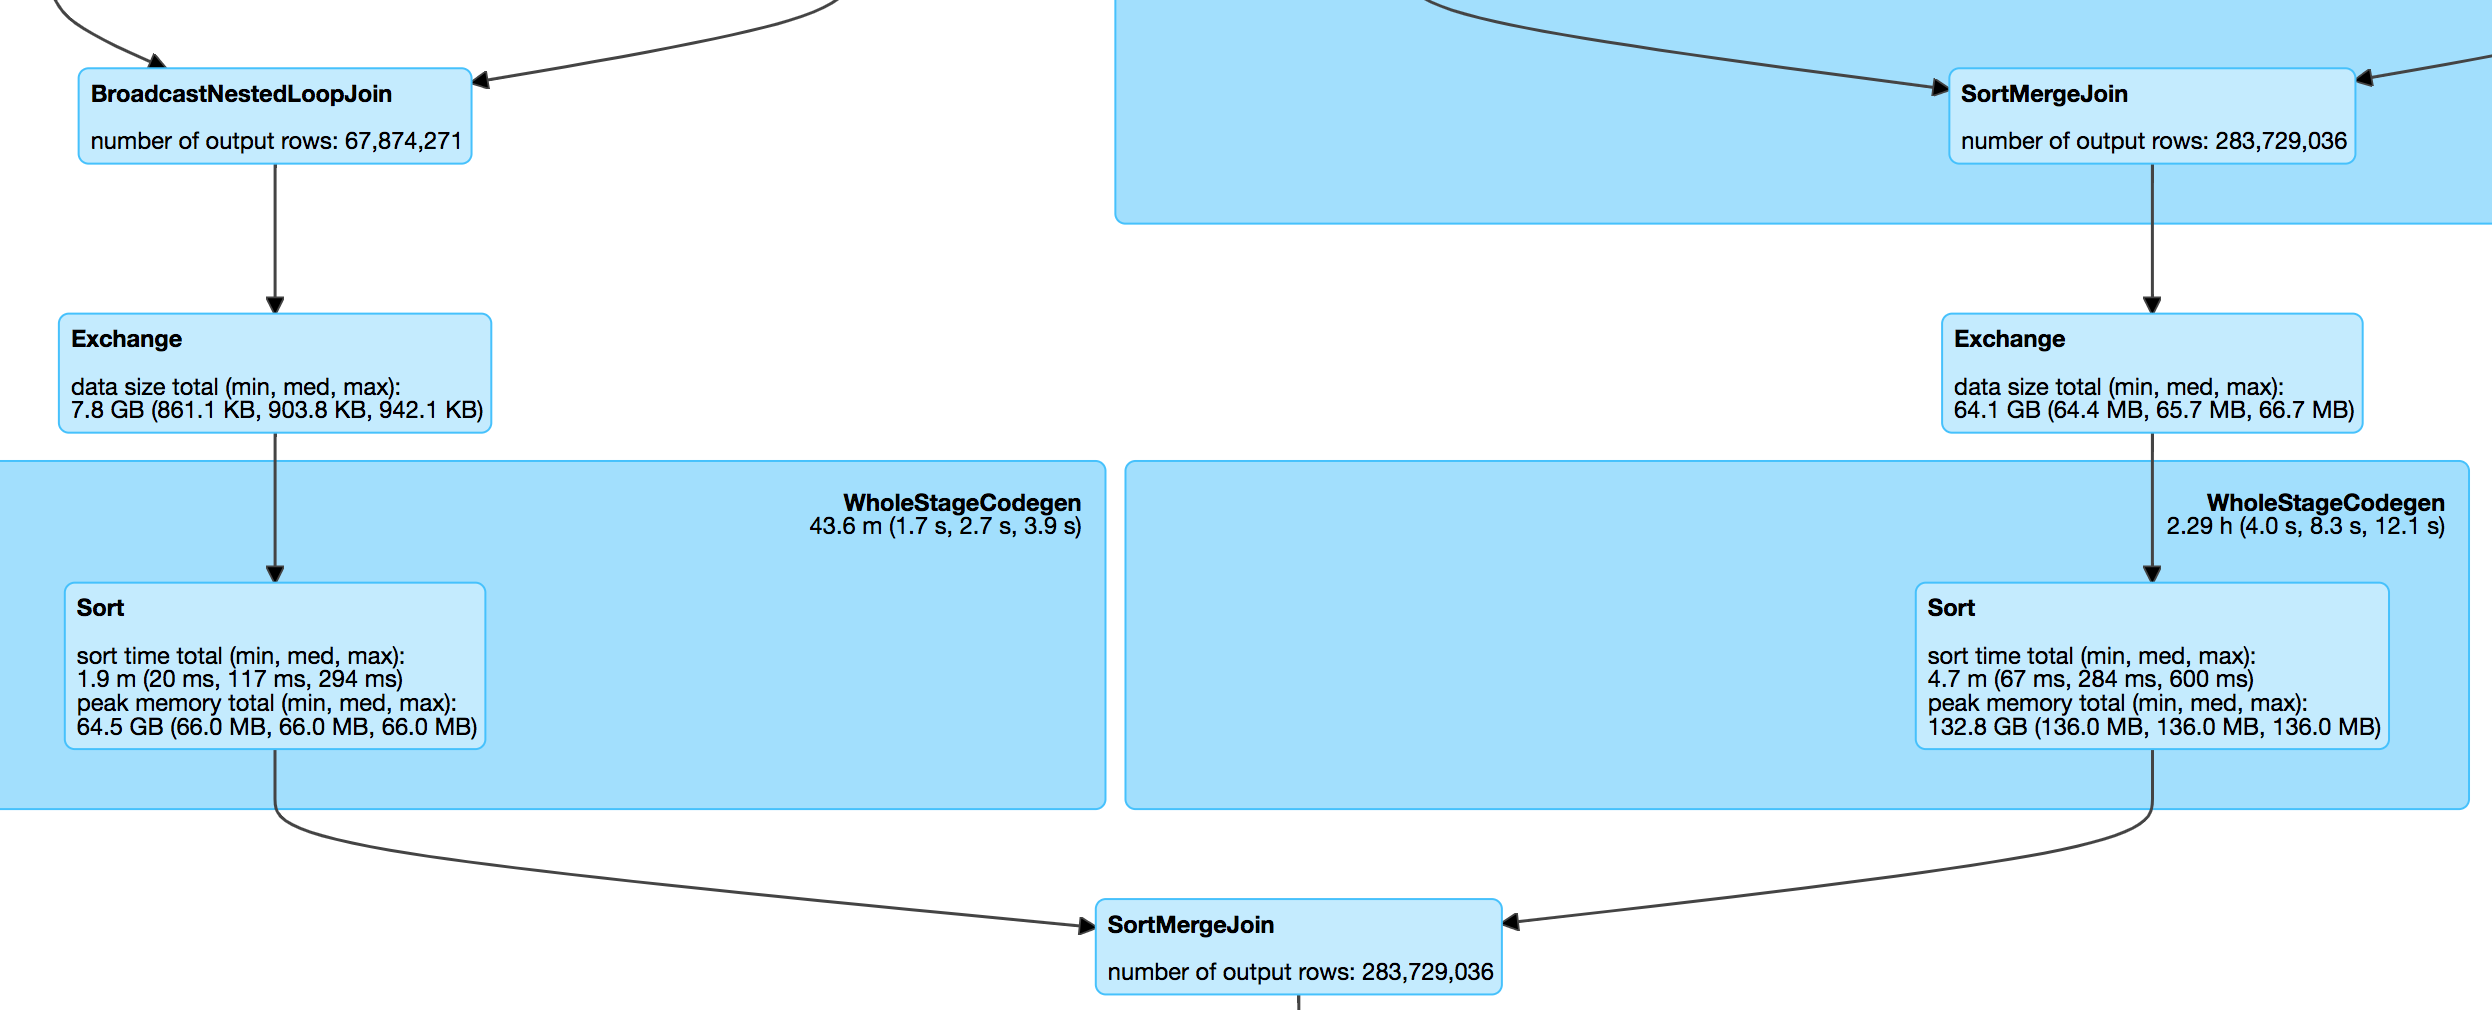
Important thing to note is the the final SortMergeJoin showing output records, 283 million odd. (I forgot to take snapshot of this view with TBs of spill)
We now had a solution in which each day would take 1-2 hours to run depending on how much data that day hate, importantly it needed 75 R44xlarge instance costing 0.4-0.5 cents an hour on the spot market. Throwing less machines or machines with lower spec resulted in the job taking longer.
Processing Backlog
With each day taking anywhere between 1-2 hours, the cost came to about 50-60 dollars for each day. For a backlog of 6 months, the cost was deemed too high for this piece of analysis!
There must be a way to reduce cost?
As always, "it works" is not the end of the task. Can we make it cost less? Because this is obviously a very important piece of analysis that the management wants BUT it should not cost an arm and a leg.
This led to further rounds of investigations. Any job/process/program/software would fall in one of these 4 categories:
- CPU intensive
- Memory Intensive
- I/O Intensive
- Network Intensive
That is all there is in any software optimisation work, simple. Our first problem was I/O and Network in which due to duplicates our job was reading and writing too much data over the network.
So, lets look (in ganglia) which category our job now falls in:
Network
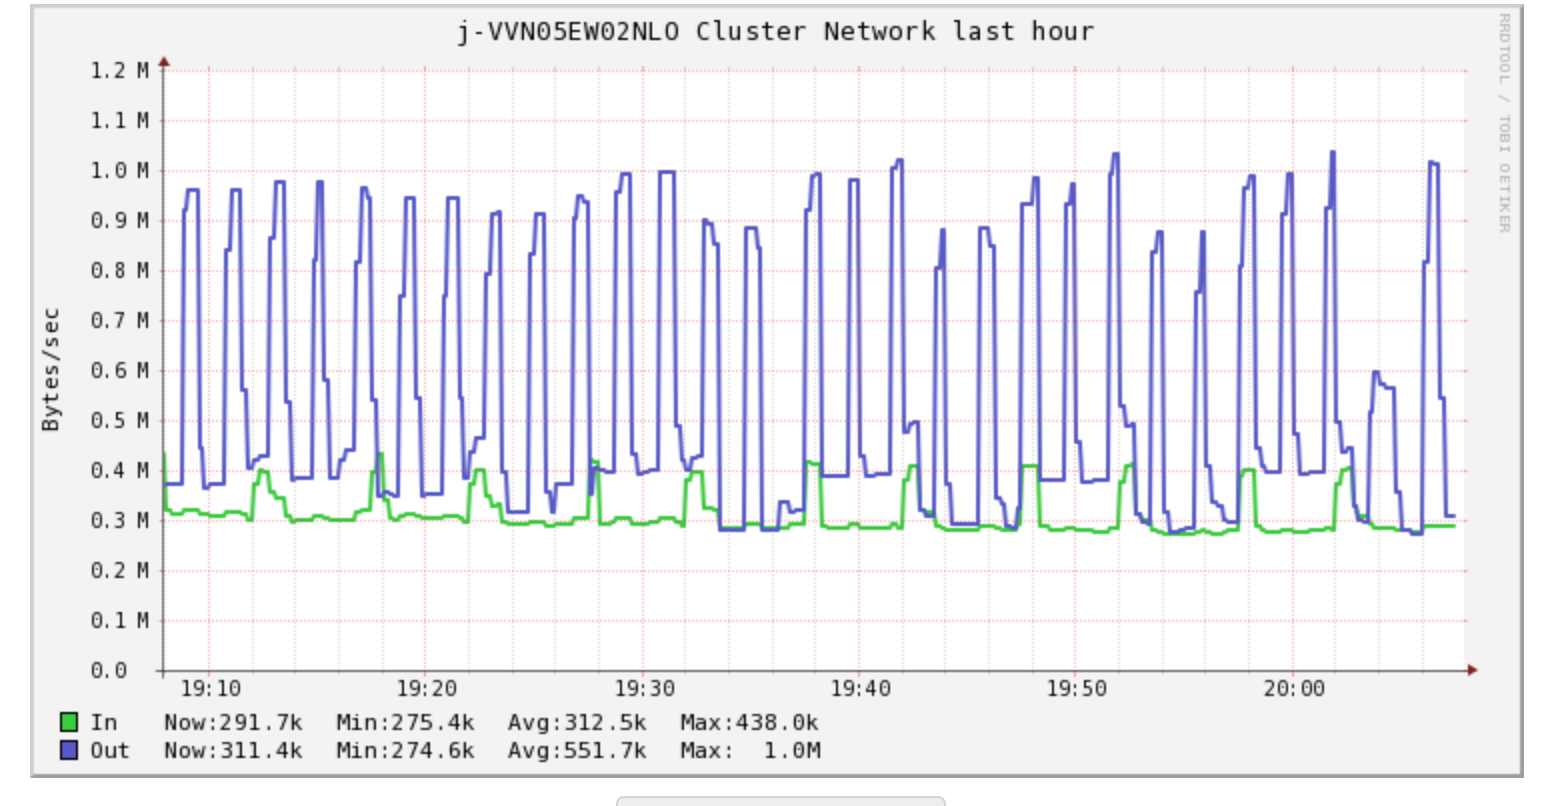
Network traffic is pretty consistent and nothing too be alarmed of.
Memory
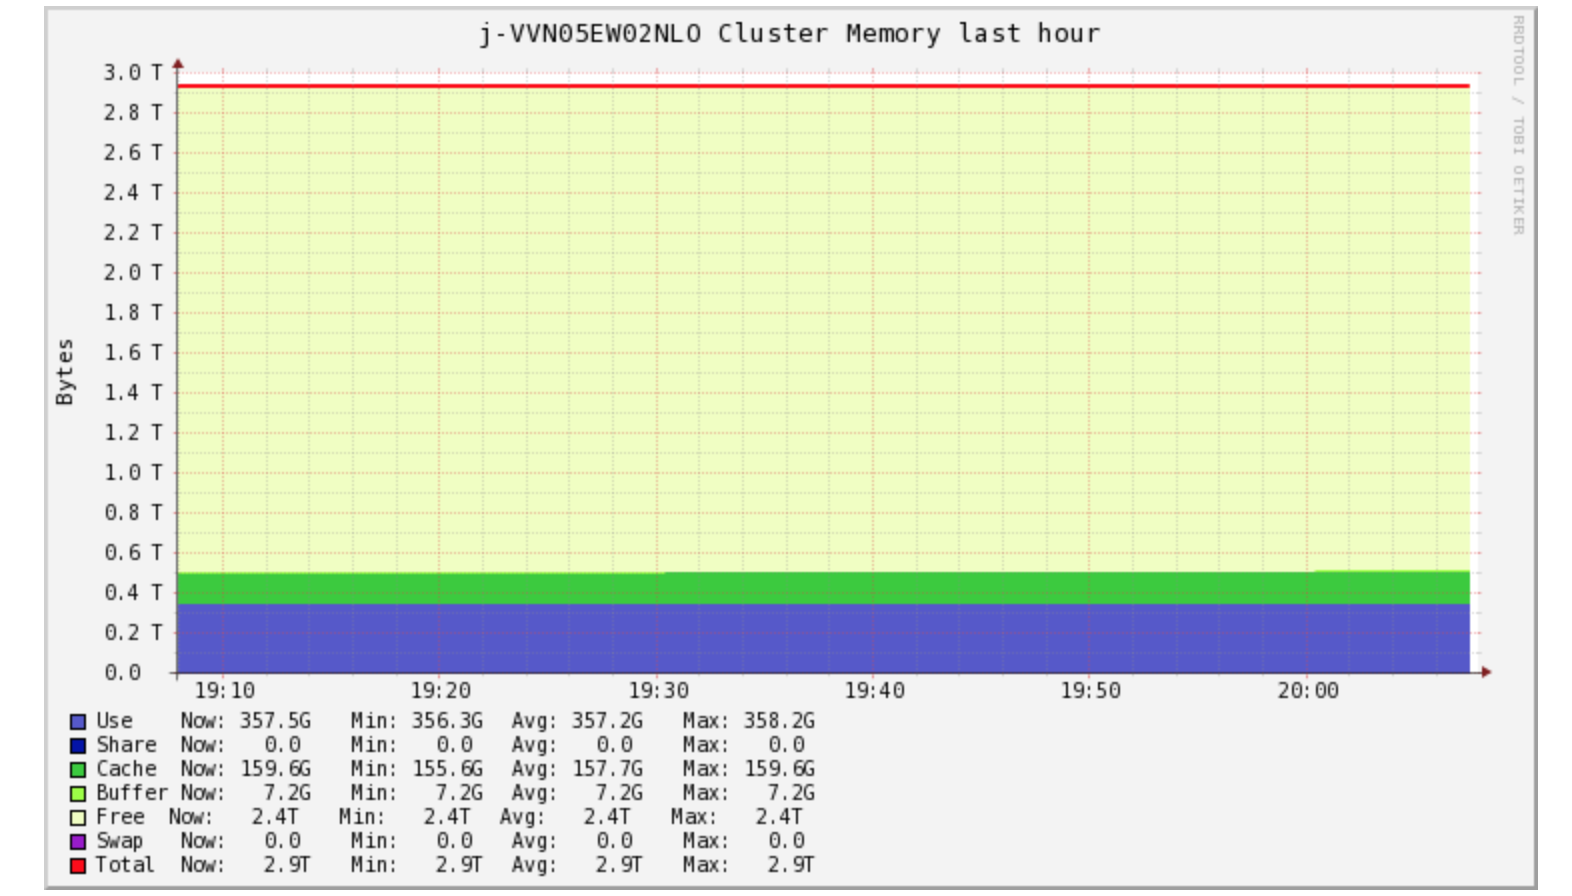
Even after having TBs of RAM at its disposal, the job is not utilizing much of RAM.
CPU
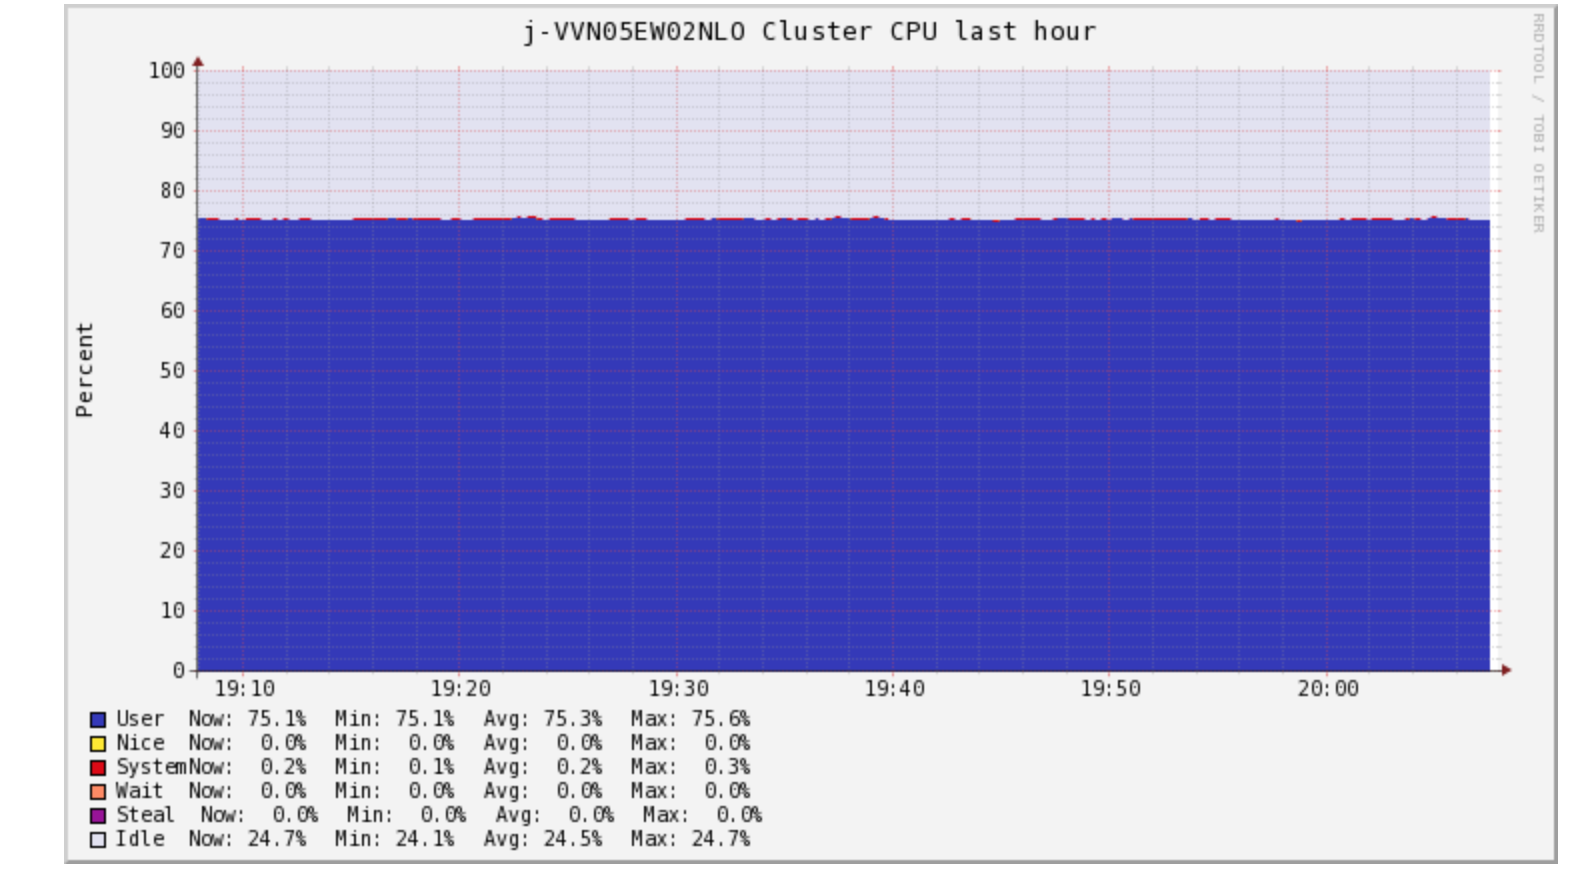
CPU usage is high and consistently high. Let's look at it a bit differently
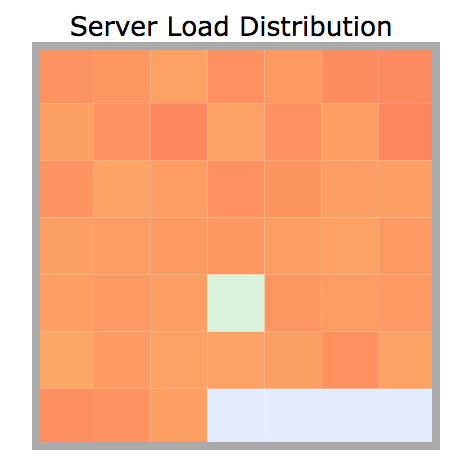
All the cluster nodes are consistently busy and for a long time.
Our job is CPU Bound or CPU intensive. Great. How do we know what is causing this and how to solve this?
Do we still have data skew?
Based on this evidence, even if we have a natural data skew in data, it is not a big concern as all machines are equally busy and they are busy all the time. In a data skew, we would have a few tasks/machines doing a lot more for a long time.
Serendipity
We kept on testing based on different theories
- "The approx distinct count may be expensive"
- "These group by clauses are expensive"
- "There is a lot of shuffle still"
And looked at Spark UI and started to go deep into the logical and physical plans.
We tested variations like
- Reduced group by columns
- Salted keys
- Combined several columns into one
- Repartitioned on a different set of columns
- removed approx counts
None of these helped us solve the problem of high CPU utilisation.
We also tried looking at the java code generated as part of WholeStageCodeGeneration via (facepalm)
results.queryExecution.debug.codegen()
#results is a data frame
Which was kind of unnecessary and foolish, as it is not going to help. Understanding that code and finding a problem would need knowing too may spark internals and one would still struggle.
Then during one of the hey-how-is-it-going-break, someone asked: "are we sure the duplicates are removed and the duplicate removal is performant?"
Aha! That seemed to be the only thing we have not checked.
We were back to looking at the physical/logical plans and we noticed a few lines that we thought were significant.
+- *(1) FileScan orc [<col-list>] Batched: true, Format: ORC, Location: InMemoryFileIndex[s3://....], PartitionFilters: [], PushedFilters: [], ReadSchema:
There were two such FileScan statements for the same partition. So spark was loading data twice and it was happening for all 4 tables!
Looking at how many files (we know how much data already) are being loaded, we found that 3 of the 4 tables had 350-450 small files. Which is another red flag as too many small files would slow down overall data load.
So our subquery is actually loading data from scratch. But does that mean that it would consume so much of CPU time?
Turns out, in traditional SQL count(*) could be slow and is well-known. This coupled with the fact that we see two separate file scans for each table led us to find alternate ways to remove these duplicate records. (At this point we are still not sure if this subquery is the source of high CPU across all machines)
How do we drop duplicates from a dataframe?
dataframe.dropDuplicates()
As easy as that, and one can pass a list of columns to this method. Which is much simpler to write as well compared to a subquery.
An important point to note is the fact that dropDuplicate() method keeps one copy of duplicate records, solving our other problem as well.
We applied dropDuplicate() on each of the dataframes after loading data with initial queries.
For example,
val df = spark.sql("SELECT p_id, col11, col12, col13, col14, col15, received_date FROM table1 p WHERE received_date = date('2018-11-01') ").dropDuplicates('p_id')
Making this change worked like wonders. The job was now finishing much much quicker and it was not at all CPU bound! The subquery to do a count(*) on a group looks to me to be the main problem. Loading the files twice is definitely not optimal and desirable but could not have led to full CPU utilisation across machines for an hour or so.
dropDuplicate(), I guess is removing duplicates while data is partitioned so it need not spend time and resources counting and that is why it is much faster.
In fact, the job was now finishing in <15 mins and we could schedule it to run on less beefy machines as well.
This is the final configuration we settled for (after a few tweaking to check runtimes & cost):
Spark Settings:
EMR:
     master instance: 1 * m4.xlarge - 8 vCPU, 16 GB
     core instances: 5 * m4.2xlarge - 16 vCPU, 32 GB
Spark:
    "spark.executor.cores" -> "3",
    "spark.executor.memory" -> "10g",
    "spark.sql.shuffle.partitions" -> "1000"
This is huge savings in terms of cost (more than 90% less) and runtime (at least 75% reduction).
Here is how CPU, Memory, and Network looked in ganglia on this new cluster:
CPU
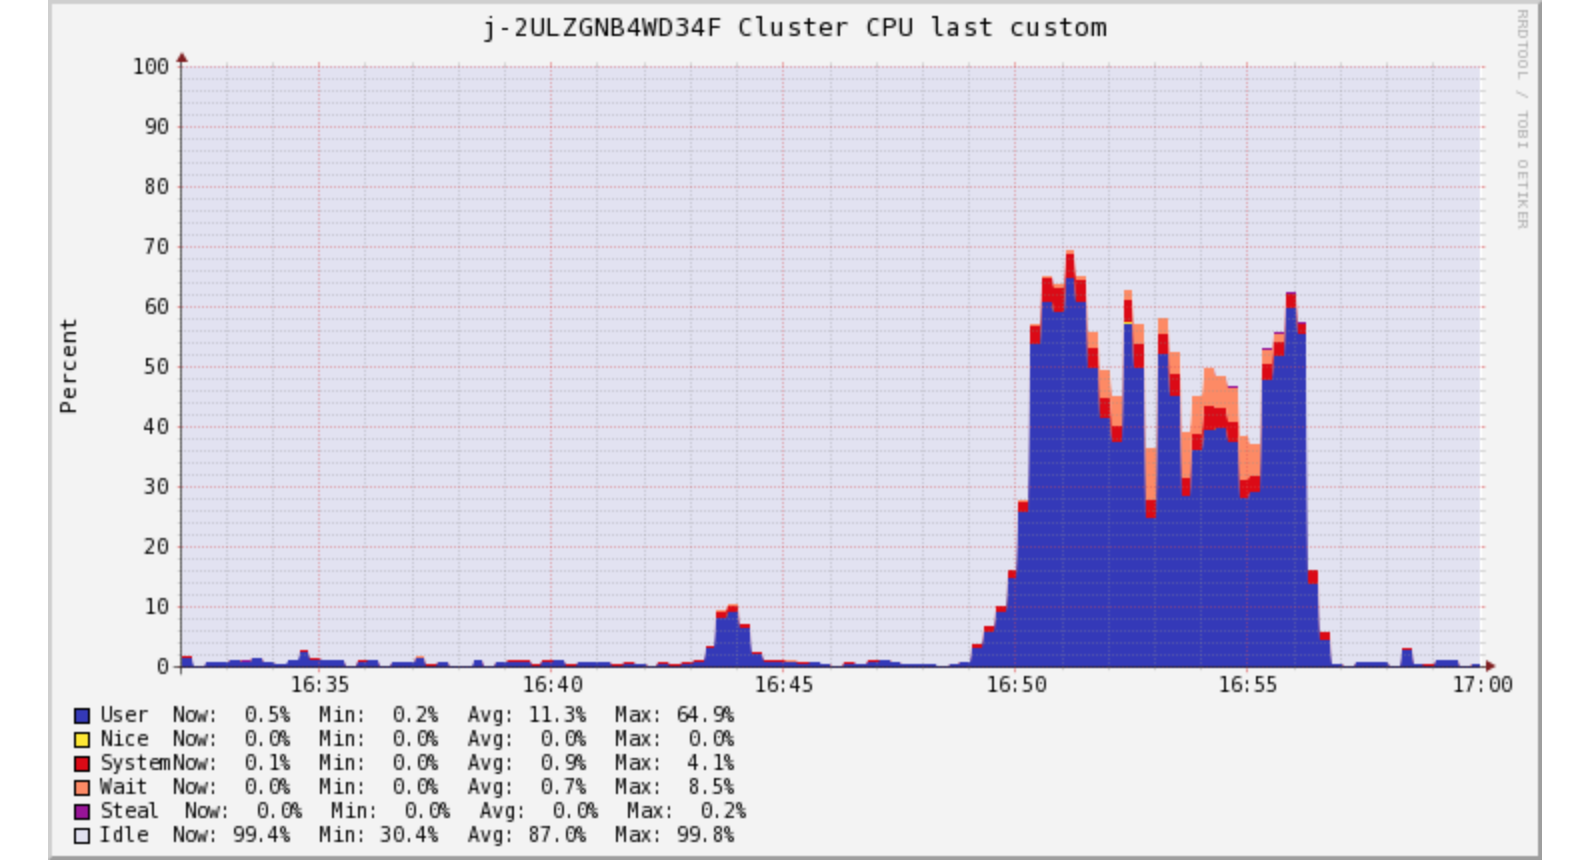
On fewer machines CPU much usage under control now.
Memory
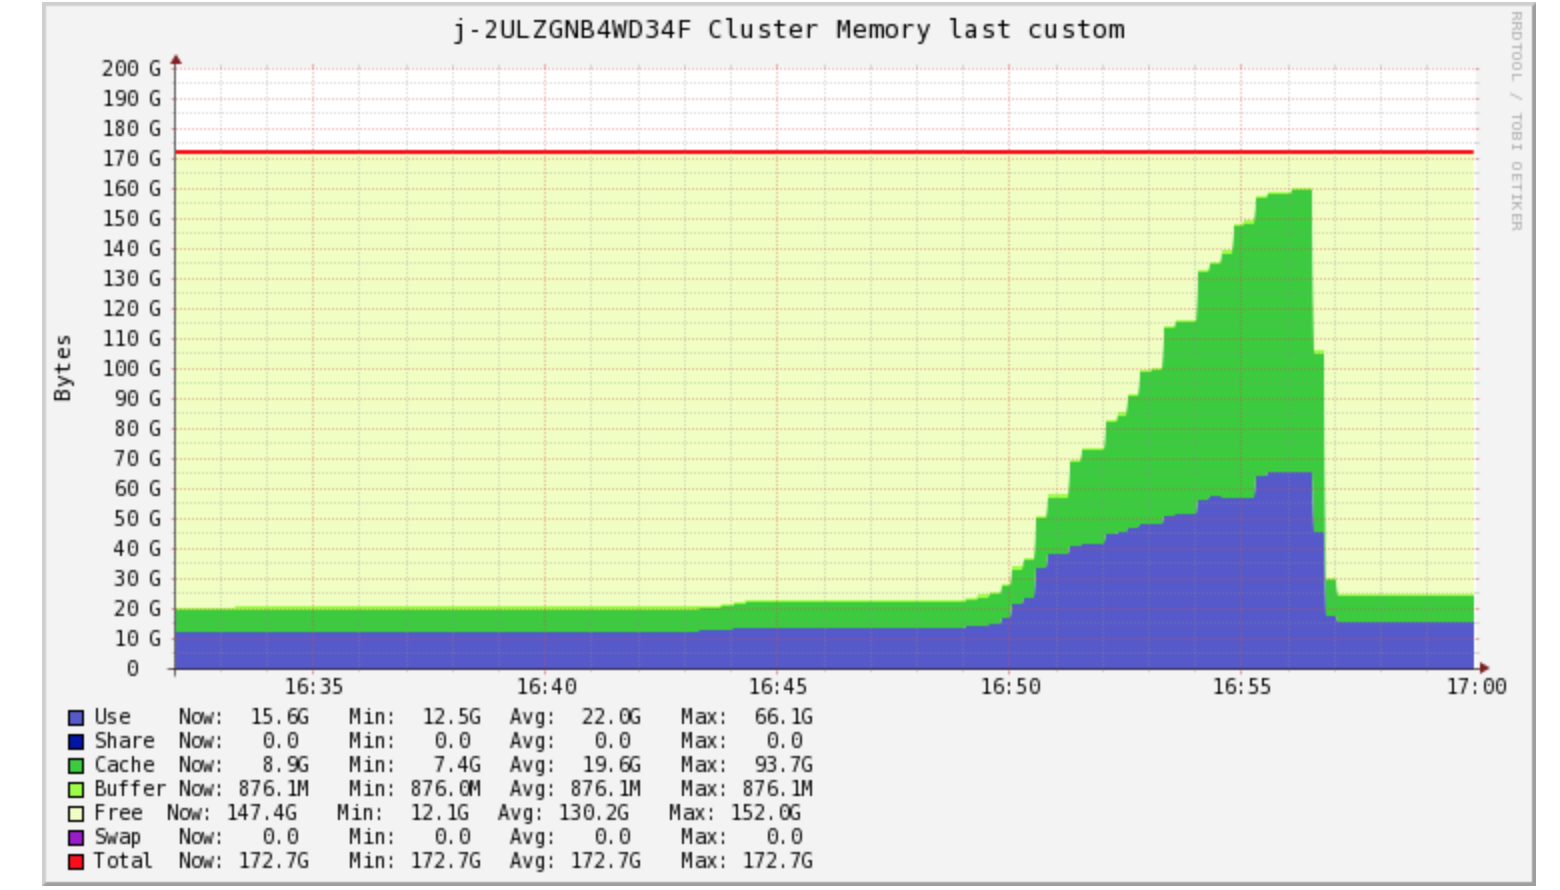
Memory usage looks up but this is overall much less RAM available to the cluster. It is still well within limits.
Network
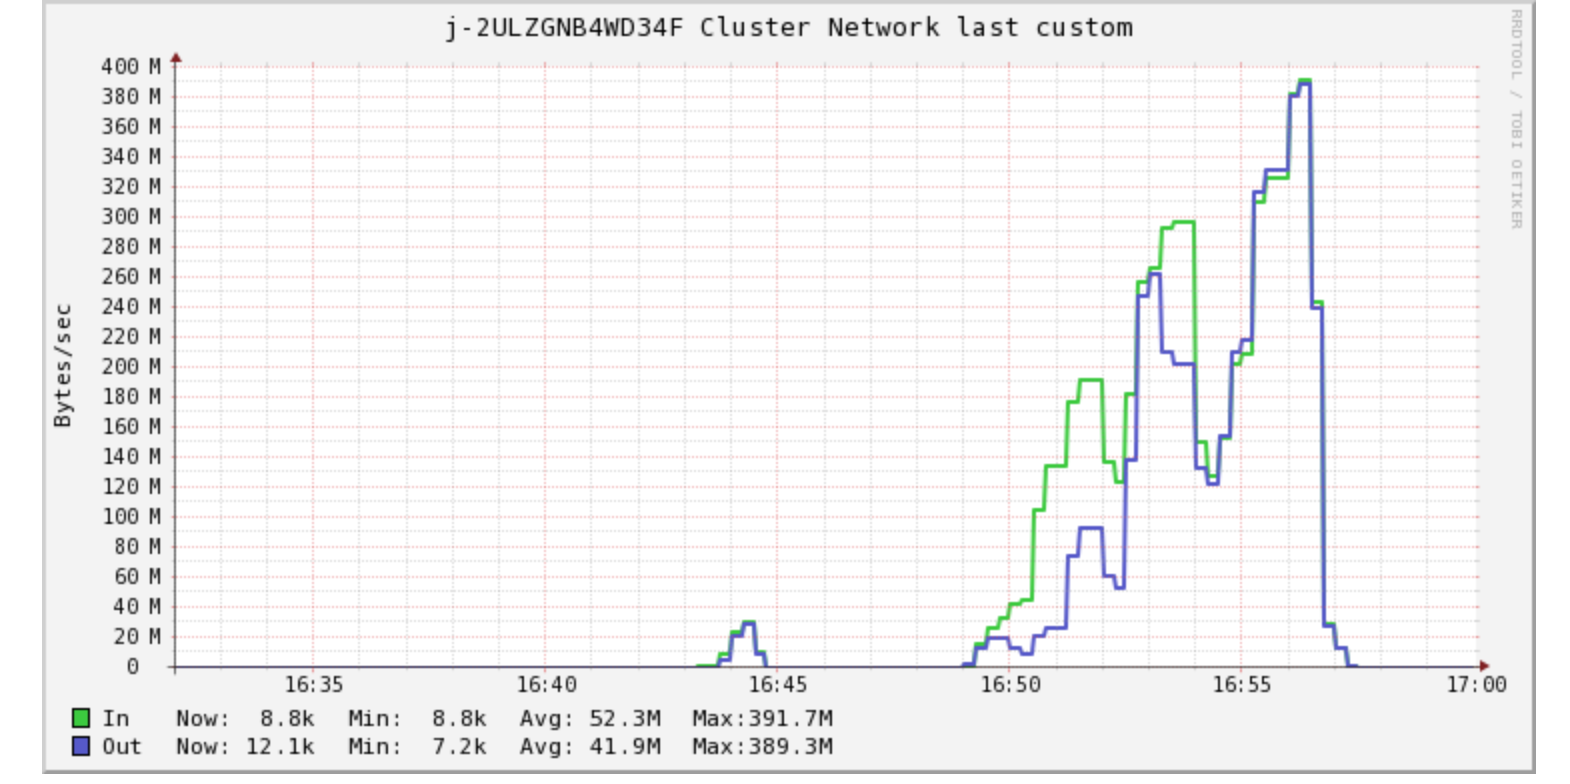
Again the graph shows an increase in usage but we have far fewer machines hence they are moving data between them during shuffle phase. Not a problem at all.
In hindsight, It looks like a trivial fix but arriving at that trivial fix is not easy. Looking at the subqueries and data involved it makes sense that the subquery hogged on to CPU as all 4 tables hold data that is supposed to be unique. Grouping this data on unique id(s) is like checking each row and creating a group having 1 record only (98%-99% of the time).
Important lessons learnt:
- Without proper tooling and monitoring access, one is shooting in the dark!
- understanding & knowing your data is of utmost importance.
- SQL could be very easy to write but one needs to understand how queries perform in spark.
- Spark performance optimisation is never just about spark, it involves many moving pieces.
Conclusion
What started with a known 'data skew' problem led to important discoveries:
- duplicate data in tables
- a solution creating a problem (subquery for counting duplicates)
- knowing data is far more important
It was easy to push back when the job was taking 1-2 hours and costing some money given the fact that the job actually never ran. But to challenge what was 'working' led to enormous savings.
Hope this helps others in some way. Questions, Comments, and Critique most welcome :-)